

Home Market Data
Summit County Housing Market Trends 2026
Summit County, Colorado, is one of the most sought after mountain resort real estate markets in the Rockies. Mountain communities always attract buyers looking for their primary residence, a vacation home, or an investment property. Market activity in Summit County is influenced by inventory, median sales price, days on market and the cyclical nature of buyer demand. Each town, from Breckenridge to Frisco, Silverthorne, Dillon, Keystone, and Copper Mountain, has its own unique opportunities. These diverse residential markets span from luxury ski-in/ski-out estates to condominiums and mountain retreats. On this page you can find up-to-date real estate market information so you can make informed decisions before buying or selling a property in Summit County. You will be able to closely monitor the real estate market to understand pricing trends and overall market conditions, which will help you negotiate the price successfully.
July 2026 Housing Market Report and Statistics in Summit County, CO
Number of Sales: 133 transactions (a 4.3% decrease from July 2025)
Average Sale Price: $1,542,702 (a 23.9% increase from July 2025)
Median Sale Price: $1,142,000 (a 14.8% increase from July 2025)
Total Sales Volume: $205,179,401 (an 18.6% increase from July 2025)
Median Days on Market: 26 days (no change from July 2025)
Average Price per Square Foot ($/sqft): $853 (a 6.5% increase from July 2025)
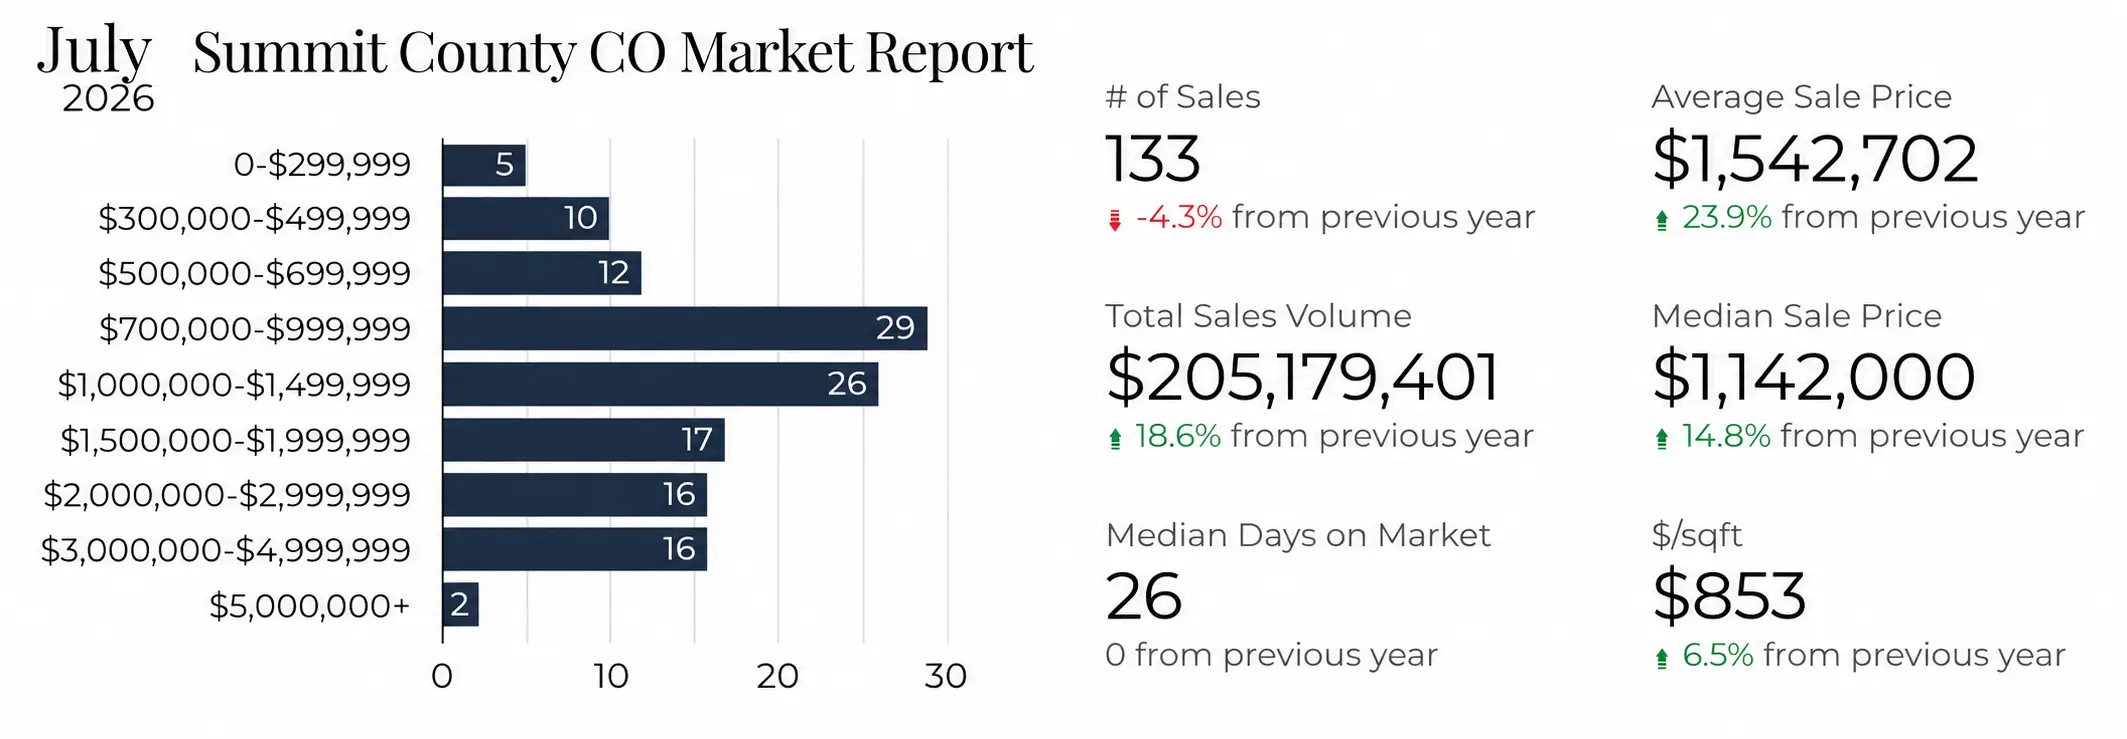
Click on Image to Get Current Summit County Housing Market Report
Percent Over/Under Asking Price: -2.8% (a 0.28 percentage-point decrease from July 2025)
Active Listings: 930 total properties currently on the market
Pending Listings: 253 properties currently under contract
Months of Supply: 7.0 months (overall market inventory level)
New Listings: 277 new properties added to the market in July (a 17.9% increase YoY)
Active Listings with Price Drops: 415 properties (representing approximately 44.6% of the active inventory)
Average Price Drop Amount: 7.5% reduction from the original list price
Average Days Until Price Drop: 123 days on the market before a price reduction occurs
Year-to-Date (YTD) 2026 Summit County Market Data
Number of Sales: 729 transactions (a 1.5% decrease from the previous year)
Total Sales Volume: $1,072,965,602 (a 4.1% increase from the previous year)
Median Sale Price: $1,150,000 (a 16.2% increase from the previous year)
Average Sale Price: $1,472,590 (cumulative average for 2026)
Average Price per Square Foot ($/sqft): $837 (cumulative average for 2026)
Median Days on Market: 30 days (a decrease of 1 day from the previous year)
Average Percent Over/Under Asking Price: -2.55% (a 0.15 percentage-point decrease from the previous year)
New Listings: 1,501 new properties added YTD (a 0.8% increase from the previous year)
Market Sales Data Reports in Summit County, CO – Updated Daily
Access Natalia’s continually updated Summit County real estate market graphs, refreshed every day to ensure you have the most current data at your fingertips. For a more granular analysis, Natalia can provide customized charts and graphs tailored to your specific real estate needs. This includes detailed breakdowns by price range, property type (residential, commercial, land), geographical area (city, zip code, or subdivision), and property subtype (single-family home, condo, or townhome). You can even request data filtered by specific criteria, such as bedrooms, bathrooms, square footage, and year built. Contact Natalia at 970-389-8899 or nbassova@gmail.com.
Median Home Price in Summit County, CO
What is the median home price in Summit County CO?
The median home price in Summit County CO is $1,142,000.
As your real estate agent in Summit County, CO, I find the median home price to be one of the most insightful numbers we look at. Simply put, the median sales price is the middle point of all home sales in a given area and time. Imagine lining up every Summit County home sold from the least expensive to the most expensive; the median is the price of the home right in the middle. This is often a more accurate reflection of the market's health than the average home price, which can be skewed by a few exceptionally high or low sales.
Average Home Price in Summit County, CO
What is the average home price in Summit County CO?
The average home price in Summit County CO is $1,542,702.
As your dedicated real estate agent in Summit County, CO, I frequently receive inquiries about the average sales price of Summit real estate properties. Think of the average home price as a snapshot of what properties have been selling for in a given area over a specific period. It's calculated by adding up the sale prices of all properties and then dividing by the total number of properties sold. This figure gives us a general idea of Summit County market trends and overall property values.
However, it's important to remember that an average can sometimes be misleading. For instance, in Summit County, our market is incredibly diverse. We have everything from cozy studios in Summit County to sprawling Summit County luxury estates. A few high-value sales can significantly pull up the average, even if the majority of homes sold were more moderately priced.
It's essential to look beyond just the average. When we're evaluating Summit County properties, we consider various factors like location, property type, size, amenities, and current market conditions to give you the most accurate and personalized assessment.
New Listings in Summit County, CO
How many new listings came on the market in Summit County CO in July 2026?
277 new listings were added to the market in July in Summit County.
If you're considering a move to Summit County, CO, or looking for a second or vacation home or investment property, you'll be pleased to know that new listings are consistently coming onto the market, offering a broader spectrum of homes to explore. The Summit County market is evolving to provide more options, and we're seeing properties that cater to various preferences and budgets. It's a fantastic time to explore the market in Summit County, as the increased selection allows for a more thoughtful and tailored home-buying experience. Natalia can sign you up for new listings in Summit County, CO. You will be receiving them as soon as they hit the market. Contact Natalia at 970-389-8899 or nbassova@gmail.com.
Active Listings in Summit County, CO
What is the current inventory in Summit County CO?
There are currently 930 active listings in Summit County.
When we discuss active listings in Summit County, CO, real estate, we're simply referring to properties that are currently on the market and available for sale. These are the homes that buyers can tour, make offers on, and ultimately purchase. As your Summit County agent, my job is to help you navigate these opportunities. Competitively priced active listings in desirable locations are generating a lot of buzz. For instance, ski-in ski-out properties in Breckenridge, Keystone, and Copper Mountains are prime examples of hot active listings.
Sold Listings in Summit County, CO
How many homes were sold in Summit County CO in July 2026?
133 homes were sold in Summit County in July.
Understanding sold data is critical to successfully navigating the Summit County, CO, property market. These records provide a realistic benchmark for both buyers and sellers by showing actual market value rather than just list prices. I recently helped clients sell their Summit County waterfront property by analyzing similar three-bedroom homes sold within the last 90 days. By aligning our strategy with these real-world transactions, we secured a fast sale at a price that exceeded their expectations. If you would like to put your property on the market and need sold listings to come up with the competitive listing price, contact Natalia at 970-389-8899 or nbassova@gmail.com. She will help you price your home correctly and sell it within the shortest possible time according to the current Summit County real estate market.
Pending Sales in Summit County, CO
How many homes went under contract in Summit County in July 2026?
253 homes went under contract in Summit County in July.
Unlock the potential of pending listings with Summit County Real Estate. When a property moves to 'pending' status, it signals a significant step towards a successful sale, indicating an accepted offer and the commencement of crucial transactional processes like inspections, appraisals, and financing. While this phase demonstrates strong market activity, it also presents unique opportunities. As a dedicated Summit County agent, I empower my clients to understand that 'pending' does not always mean 'unavailable.' Just recently, my discerning clients, Elizabeth and John, found their dream luxury home in Summit County, which went pending. By strategically monitoring the market, we capitalized on an unexpected turn of events when the deal encountered a financing hurdle, allowing Elizabeth and John to successfully secure their desired property. This exemplifies why 'pending' can translate to 'opportunity' for informed buyers – a promising stage where vigilance can lead to your next home.
Average Number of Showings to Pending in Summit County, CO
How many showings are needed until a home sells in Summit County CO?
Homes receive 11 showings on average before going under contract in Summit County.
Ever wonder how many times your Summit County home will need to be shown before it finds its perfect buyer? It's a question I hear all the time as a real estate agent in Summit County, CO, and honestly, there's no crystal ball answer. However, most real estate pros agree that you can expect your home to be shown anywhere from 10 to 25 times before you're popping the champagne on a signed contract. But that's just a guideline. The real number depends on a few key players: what the Summit County market's doing (is it a buyer's paradise or a seller's dream?), how smartly your Summit County home is priced, and its overall vibe and condition. Take, for example, a client of mine whose stunning, well-priced home in Silverthorne flew off the market with a full-price offer after just two showings in a super-hot seller's market! Conversely, another client's home in Dillon, which needed a little TLC in a more balanced market, took about 12 showings to connect with the right buyer. This demonstrates that, while averages provide a general idea, every home's journey to 'pending' is a unique story!
Average Days on Market in Summit County, CO
How quickly are properties selling in Summit County CO?
The average days on market (DOM) for a property in Summit County is 81 days.
When selling your Summit County home, one key to success is understanding the market's pace. That's why I always guide my clients through the "Average Days on Market" (DOM). This metric is simple: it’s the average number of days a home is for sale before an offer is accepted. If the DOM is low, it signals a seller's market with strong demand, meaning your property could sell quickly and for a great price. If the DOM is high, it points to a buyer's market, suggesting we may need a more competitive strategy. For instance, if your golf course home in Summit County is on the market for 60 days while the local average is 30, it’s a prompt for us to refine our strategy. My role as your Summit County agent is to use this data to ensure your Summit County property is perfectly positioned to sell efficiently and achieve your goals.
Average Price per Square Foot in Summit County, CO
What is the average price per square foot in Summit County CO?
The average price per square foot in Summit County is $853.
Understanding the average price per square foot is fundamental in the Summit County Housing market, guiding both buyers and sellers in assessing a property's worth in relation to its size. This figure is calculated by taking the total sale price of a Summit County residence and dividing it by its finished square footage. It offers a consistent method for evaluating various Summit County properties, irrespective of their individual sizes. As a Summit County real estate agent, if I'm presenting two new construction homes in Summit County—one at $5,250,000 with 6,516 square feet and another at $4,625,000 with 4,095 square feet—the price per square foot quickly clarifies their comparative value. The first home is $805.71 per square foot, whereas the second is $1,129.43 per square foot. This immediate insight indicates that, despite its lower overall price, the second home is more costly on a per-square-foot basis, leading us to explore reasons such as premium finishes, a more desirable lot, better vistas, or various amenities (hot tub, exercise room, wine cellar, fire pit, sauna, steam room, etc.). While a powerful aid for making educated choices, it's always essential to factor in elements like location, condition, and amenities.
Average % Over/Under Asking Price in Summit County, CO
Are properties in Summit County CO selling at, below or over the asking price?
Properties in Summit County are selling at an average of 2.8% below their asking price.
To effectively guide you in pricing your home in Summit County, CO, and understanding the market's pulse, I, as your real estate agent, closely monitor the average percentage of the last list price. This metric provides a clear picture of how close homes in a given Summit County locale are selling to their most recent asking price. For instance, an average of 98% signifies that, on the whole, properties are selling for 98% of their final list price. Should we observe an average of 102%, it points to a highly competitive market where homes often sell above asking due to heightened demand or bidding wars. This is a powerful indicator of buyer enthusiasm and bargaining power. If we're preparing to list your beautiful lakefront property in an area consistently showing a 95% average, it informs us that buyers are typically negotiating a 5% discount. With this knowledge, we can strategically set your home's price to draw in motivated buyers, while also factoring in potential offers slightly under our initial asking, thus ensuring we're always ahead in achieving your selling aspirations.
Dollar Volume of Closed Sales in Summit County, CO
What was the total sales volume for July 2026 in Summit County CO?
The total sales volume in Summit County is $205,179,401 in July.
In Summit County, CO, the dollar volume of closed sales signifies the total financial worth of all real estate transactions finalized over a specific timeframe. It acts as a primary indicator of the local market's vitality and engagement, illustrating the actual amount of money circulating through property sales. Visualize this figure as the final tally on a colossal ledger for every home purchased. To illustrate, if Natalia, as a real estate professional, completes three sales in a given month—a $700,000 charming home in Blue River, a $3,850,000 spacious house in Keystone, and a $2,800,000 upscale condominium in Copper Mountain—her individual dollar volume of closed sales for that month would be $7,350,000. This measurement provides a more profound understanding of sales efficacy and the overall market strength, moving beyond simple unit counts.
Monthly Supply of Homes for Sale in Summit County, CO
What is the monthly supply of homes (overall market inventory level) in Summit County CO?
Summit County market has 7 months of supply. It is the buyer's market now.
Understanding the Monthly Supply of Homes for Sale provides a clear picture of the Summit County home paces. This metric gauges the balance between the number of available properties and the rate at which they are purchased. Visualize it as a "depletion timer" for existing inventory: it calculates the exact number of months required to sell every home currently listed in Summit County, assuming no additional properties enter the market. In my role as a Summit County broker, I often utilize this data point to inform my clients about their position in negotiations. A limited supply—generally under five months—characterizes a seller's market, where buyers contend for fewer options, frequently leading to price increases. Conversely, a supply exceeding six months signifies a buyer's market, offering greater flexibility and negotiation power. For example, when Silverthorne neighborhoods have 250 homes for sale and we consistently sell 100 homes per month, which translates to a two-and-a-half month supply. This suggests a rapidly moving market, urging buyers to act decisively with their strongest offers.
Data Source
All market data is sourced from Altitude MLS, Inc via InfoSparks (ShowingTime Plus, LLC). Data is updated in real-time according to MLS feed updates.