

Home Market Data Dillon Market
Dillon Real Estate Market Trends & Statistics 2026
Dillon real estate comprises a much more diverse area than other Summit County towns. While Breckenridge, Copper Mountain, and Keystone tend to have high-end properties throughout their respective areas, Dillon properties range from hundreds of the most affordable condos in the county to multi-million dollar mansions. This highly varied range skews the average sales prices in Dillon. Read more
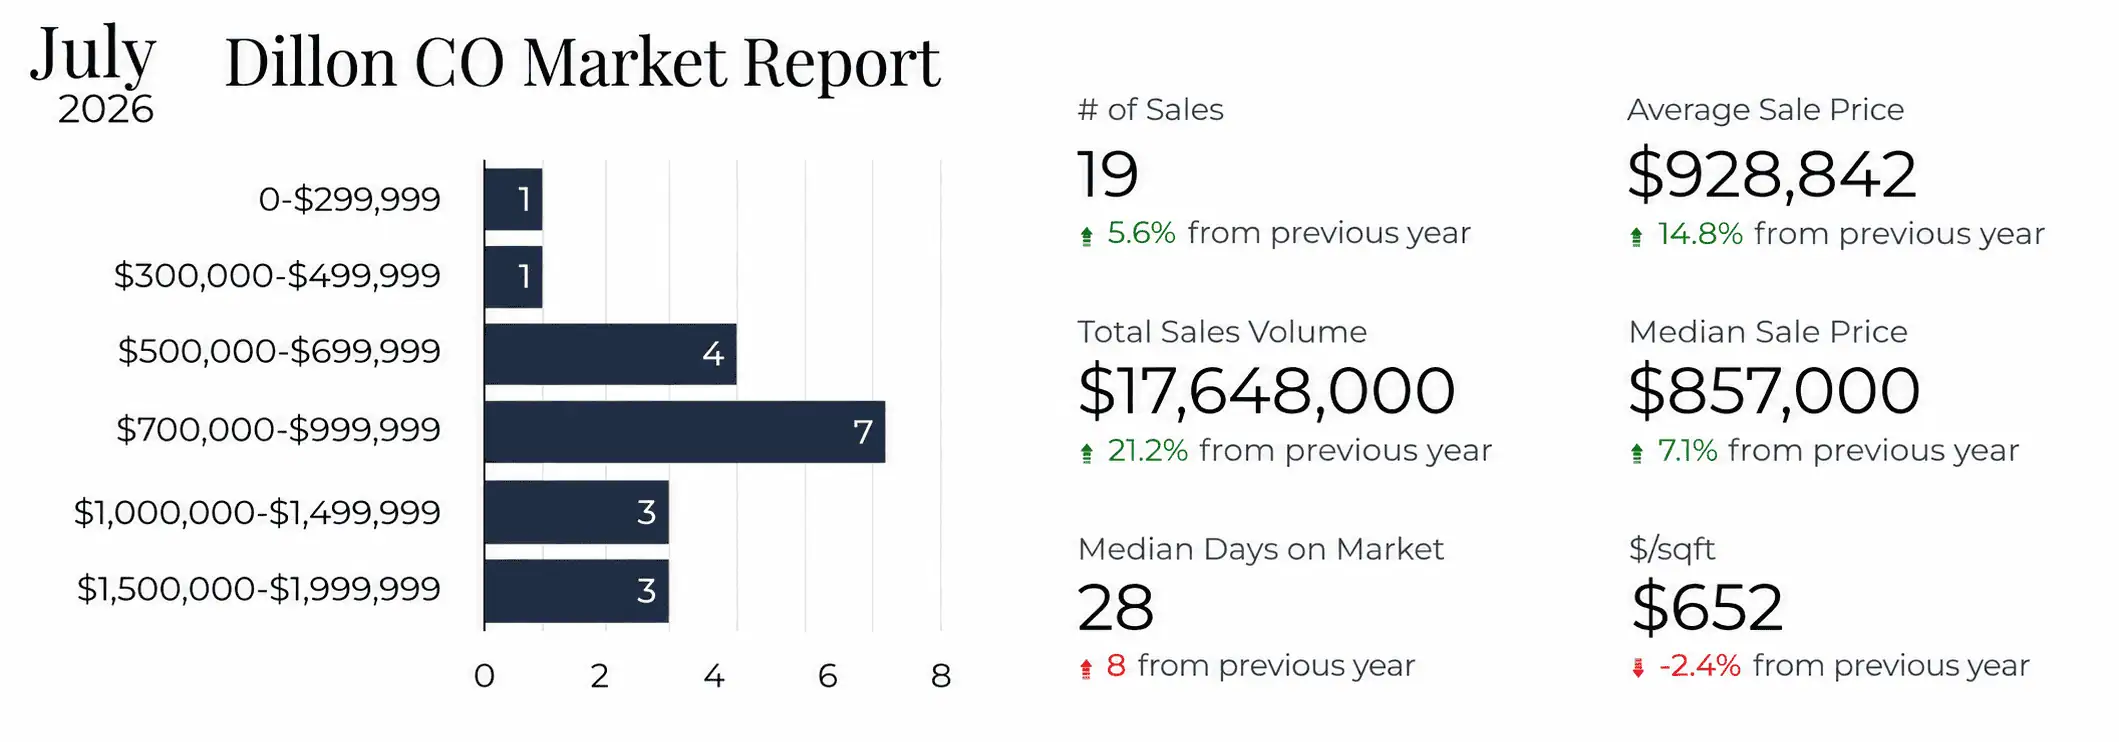
July 2026 Housing Market Report and Statistics in Dillon, CO
Number of Sales: 19 transactions (a 5.6% increase from July 2025)
Average Sale Price: $928,842 (a 14.8% increase from July 2025)
Median Sale Price: $857,000 (a 7.1% increase from July 2025)
Total Sales Volume: $17,648,000 (a 21.2% increase from July 2025)
Median Days on Market: 28 days (an increase of 8 days from July 2025)
Average Price per Square Foot ($/sqft): $652 (a 2.4% decrease from July 2025)
Click on Image to Get Current Dillon Housing Market Report
Percent Over/Under Asking Price: -3.2% (a 1.71 percentage-point decrease from July 2025)
Active Listings: 119 total properties currently on the market
Pending Listings: 18 properties currently under contract
Months of Supply: 6.3 months (overall market inventory level)
New Listings: 40 new properties added to the market in July (a 33.3% increase YoY)
Active Listings with Price Drops: 57 properties (representing 47.9% of the active inventory)
Average Price Drop Amount: 5.7% reduction from the original list price
Average Days Until Price Drop: 77 days on the market before a price reduction occurs
Year-to-Date (YTD) 2026 Dillon Housing Market Data
Number of Sales: 70 transactions (a 19.5% decrease from the previous year)
Total Sales Volume: $71,867,314 (an 8.9% decrease from the previous year)
Median Sale Price: $935,000 (a 17.0% increase from the previous year)
Average Sale Price: $1,026,676 (cumulative average for 2026)
Average Price per Square Foot ($/sqft): $640 (cumulative average for 2026)
Median Days on Market: 30 days (an increase of 6 days from the previous year)
Average Percent Over/Under Asking Price: -3.29% (a 1.00 percentage-point decrease from the previous year)
New Listings: 192 new properties added YTD (a 15.0% increase from the previous year)
Real-Time Housing Market Data Reports in Dillon, CO, Updated Daily
Every day, we update these graphs to provide you with the most recent historic market statistics in Dillon, CO. If you require more specific data, Natalia can provide customized charts and graphs for any market segment. From price ranges and property types (residential, commercial, land) to specific locations (city, zip code, subdivision) and property details (subtype, bedrooms, bathrooms, square footage, and year built), Natalia is here to help you find the exact information you are looking for.
Median Home Price in Dillon, CO
What is the median home price in Dillon CO?
The median home price in Dillon is $857,000.
Understanding the median sales price is one of the most powerful tools we have when navigating the Dillon housing market together. Unlike the "average" price, which simply adds everything up and divides it, the median finds the exact midpoint of all sales, effectively eliminating the "outliers." This is crucial because Dillon real estate isn't uniform. Let's say a neighborhood typically has homes selling around $750,000. If a massive, custom-built luxury home suddenly sells for $3 million in that same neighborhood, the average price will skyrocket, giving a false impression that the whole area just became much pricier. The median price, however, ignores that single extreme sale and stays anchored near $750,000, providing us with a realistic, grounded baseline for what a normal home is actually worth right now.
Average Home Price in Dillon, CO
What is the average home price in Dillon CO?
The average home price in Dillon CO is $928,842.
The calculation for the average sales price of Dillon properties involves summing the sale prices of all relevant properties within a given area and time, then dividing by the total number of properties sold. This provides a straightforward indicator of the market's general vitality and value movements.
It is, however, essential to look beyond this single numerical representation. An average sales price of $850,000 in a neighborhood, for instance, does not signify that all homes are valued identically. Instead, it often represents a spectrum of properties, including smaller, older homes at $550,000 and larger, recently modernized properties at $1,200,000. The average simply reconciles these differing values.
New Listings in Dillon, CO
How many new listings came on the market in Dillon CO in July 2026?
40 new listings were added to the market in July in Dillon.
For prospective homeowners, new listings in Dillon represent the freshest inventory available, often reflecting the most up-to-date market values and seller motivations. These properties can sometimes offer a smoother transaction process, as sellers of new listings are typically eager to move forward. My role as your Dillon agent is to ensure you're among the first to know about these opportunities. For example, I have a system that alerts me instantly when a new property matching your specific needs, like a three-bedroom home with outstanding Lake Dillon views in the Pinnacle at Summerwood subdivision, becomes available. This proactive approach ensures you never miss out on a prime opportunity. To sign up for new listings in Dillon, contact Natalia at 970-389-8899 or nbassova@gmail.com
Active Listings in Dillon, CO
How many active listings are on the market (total inventory) in Dillon CO?
There are 119 active listings in Dillon.
Simply put, an active listing is a home that's ready for you to buy in Dillon right now. It's been prepared, listed, and is awaiting its new owner. As a real estate agent in Dillon, I see active listings as the heart of the market. Consider the lovely spacious house with a large backyard in the Dillon New Town subdivision near the lake that's been an active listing for about a month. It's still active, so you can still make it yours, and we can strategize on the best way to do that.
Sold Listings in Dillon, CO
How many homes were sold in Dillon during July 2026?
There were only 19 sales recorded in Dillon in July 2026.
Sold listings offer a clear window into the true pulse of the Dillon real estate market. They move beyond mere speculation, providing factual data on completed transactions. This information is invaluable for setting accurate prices, making informed offers, and understanding neighborhood value. As your Dillon real estate agent, I rely heavily on this data. Imagine you're thinking of selling your charming home in Whispering Pines Ranch. By reviewing recent sold listings of single-family homes with similar features and square footage in your area, we can pinpoint an optimal listing price. If a comparable home just sold for $2,050,000 after multiple offers, it suggests your home, if presented well, could achieve a similar outcome, giving us a strong starting point for our strategy.
Pending Sales in Dillon, CO
How many homes went under contract in Dillon CO in July 2026?
18 homes went pending in Dillon in July.
When a property shows as "pending" on the market, it signifies that a buyer and seller have agreed on terms, and the transaction is actively progressing towards closing. It's a period where the contract is in force, and both parties are working to satisfy any conditions before the ownership officially transfers. As an agent in Dillon, CO, I often explain to my clients that this phase is where the real work begins after the excitement of an accepted offer. For instance, I once had a pending sale where the buyer needed to sell their current home first. We managed both transactions simultaneously, ensuring a smooth transition for everyone involved.
Average Number of Showings to Pending in Dillon, CO
How many showings on average are needed before a home goes under contract in Dillon CO?
Homes receive 11 showings on average before going under contract in Dillon.
From my experience, the journey from showings to a pending sale is a blend of buyer engagement and strategic positioning. While benchmarks suggest 10–25 showings as a common range for a property to go under contract, the key is to understand the feedback from each showing and adapt our strategy. Occasionally, a high number of showings without an offer indicates a pricing issue or a need to adjust our marketing. For instance, I once had a beautiful family home in Dillon that received 15 showings over a few weeks but no offers. After gathering feedback, we made a slight price adjustment and highlighted its unique backyard setting in our marketing. Within days, we received three additional showings and a strong offer, demonstrating that a minor strategic adjustment can significantly impact our ability to connect with the right buyer.
Average Days on Market in Dillon, CO
How long does it typically take for a home to sell in Dillon?
The average time a listing spends on the market is 56 days in Dillon.
Understanding average days on market (DOM) is fundamental to a successful real estate transaction. From my perspective as an agent in Dillon, CO, DOM isn't just a number; it tells a story about how buyers are perceiving properties in a given area. When a home sells quickly, say in just 15 days when the average for similar properties is 45 days, it often means it was priced perfectly, marketed effectively, and presented impeccably. This swift sale benefits both buyers and sellers by creating a sense of urgency and validating the property's value. However, if a property lingers on the market for an extended period, it can sometimes lead to buyer apprehension, making it harder to secure an offer. My role is to interpret these trends for you, ensuring we position your Dillon home optimally. For example, if the average DOM for luxury condos in downtown is 90 days, and your unit has been listed for 120, we might discuss staging improvements or a strategic price reduction to reignite buyer interest and align with market expectations.
Average Price per Square Foot in Dillon, CO
What is the average price per square foot in the Dillon area?
The average price per square foot in Dillon is $652.
Understanding the average price per square foot in Dillon is incredibly valuable. This metric provides a broad overview of property values within a specific neighborhood or community by averaging the price per square foot of all recently sold homes. It helps us gauge the overall Dillon market health and identify trends, offering a more comprehensive perspective than looking at individual properties alone. For example, if the average price per square foot in the Soda Creek at Lake Dillon neighborhood is $550, and a new listing comes on the market at $675 per square foot, it immediately signals that this particular home is priced above the neighborhood average. This doesn't necessarily mean it's overpriced; it prompts us to investigate further, considering factors like recent renovations, unique features, or a premium location within Soda Creek at Lake Dillon that might justify the higher value. Conversely, a property listed below the average might represent a great deal or indicate potential issues, such as necessary repairs, less desirable locations, or outdated features that could affect its marketability. This area-wide average is a fundamental benchmark for both buyers and sellers to set realistic expectations and make strategic decisions in a dynamic market.
Average % Over/Under Asking Price in Dillon, CO
Are homes in Dillon selling for their full asking price?
On average, homes in Dillon are selling for 3.2% under their asking price. This suggests that buyers currently have more room for negotiation than they did in previous years.
From my real estate agent's perspective, the average percentage of the last list price is a crucial metric that reveals the pulse of the local housing market in Dillon. It measures the average ratio of a property's final sale price to its last advertised list price. A percentage above 100% (which can happen in highly competitive markets) means homes are frequently selling for more than their asking price, often due to bidding wars. If the percentage is below 100%, it indicates that homes are typically selling for less than the asking price. This figure is a powerful tool for understanding market dynamics and setting expectations. For instance, if I'm working with a seller and the average percentage of the last list price in their area is 97%, I'd explain that while their home might be listed at $2,500,000, the market trend suggests they should anticipate offers closer to $2,425,000. This helps us manage expectations and ensures we're making data-driven decisions, whether we're listing a property or helping a buyer craft a competitive offer.
Dollar Volume of Closed Sales in Dillon, CO
What is the total sales volume in Dillon in July 2026?
The total sales volume for July in Dillon is $17,648,000.
In real estate, comprehending the dollar volume of closed sales serves as a vital indicator of the market's health. It's the sum total of the final selling prices for all properties that have officially changed hands within a given period, say, a month or a year, in a particular area. This isn't just about how many houses are sold, but for how much. For example, if I'm analyzing the market for a client looking to sell their luxury home, a high dollar volume of closed sales for similar properties in their area suggests strong buyer demand and a healthy appetite for higher-priced homes. It gives me confidence to price their Dillon property competitively, knowing that the market has demonstrated its capacity to absorb significant sales values. It's a clear financial snapshot that helps me strategize effectively for both buyers and sellers.
Monthly Supply of Homes for Sale in Dillon, CO
Is the Dillon real estate market currently favoring buyers or sellers?
The market currently shifted toward a buyer's market. This is indicated by the 6.3 months of supply available, which is significantly higher than the levels typically seen in a seller-favored market.
When we discuss the market, you'll often hear me mention the monthly supply of homes for sale. This is a straightforward way to gauge the current balance between buyers and sellers. It shows how many months it would take to sell all the homes currently on the market in Dillon at the current sales rate. For instance, a local market with 50 homes selling each month and 250 homes currently listed indicates a 5-month supply. This indicates a relatively balanced market. However, if that supply drops to just 2 months, competition among buyers heats up, often resulting in multiple offers and homes selling above asking price. Conversely, a 7-month supply suggests a slower market where homes might sit longer, and sellers may need to be more flexible on price. Knowing these factors helps us navigate the market effectively, whether you're looking to make a competitive offer or price your home strategically.
Data Source
All market data is sourced from Altitude MLS, Inc, via InfoSparks (ShowingTime Plus, LLC). Data is updated in real-time according to MLS feed updates.