

Home Market Data Copper Mountain Market
Copper Mountain Real Estate Market 2026
Copper Mountain Ski Resort is strongly competitive with any of the other world-class ski resorts in Summit County, CO, such as Keystone and Breckenridge ski resorts, and its proximity to Vail Ski Resort makes it even more desirable.
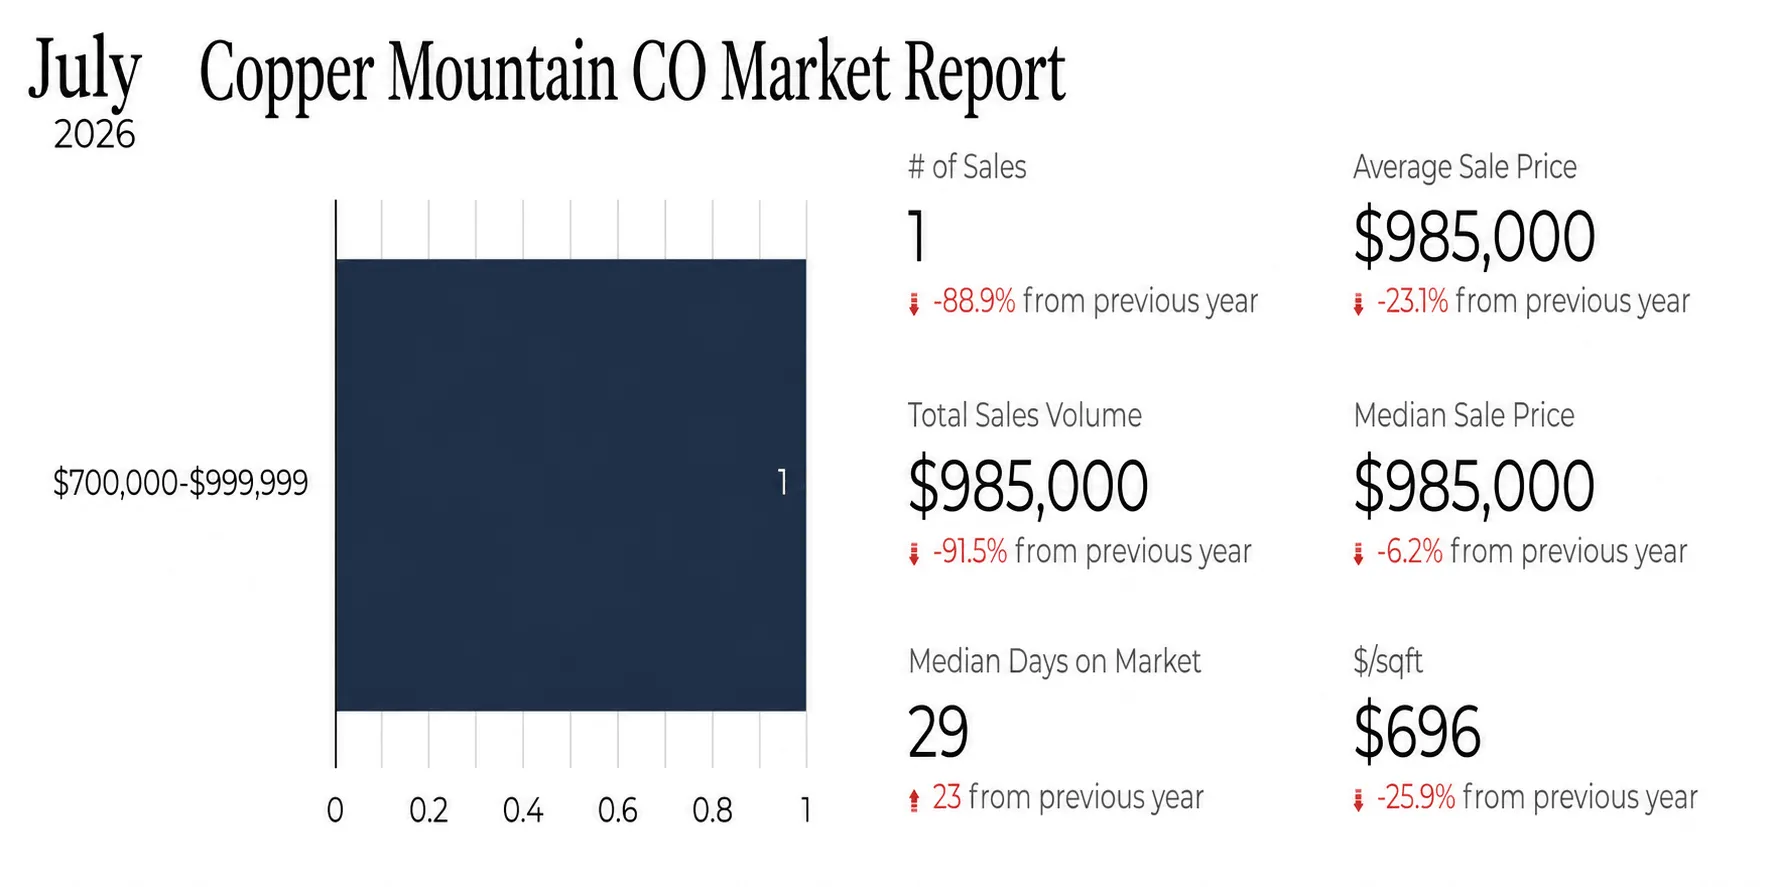
July 2026 Housing Market Report and Statistics in Copper Mountain, CO
Number of Sales: 1 transaction (an 88.9% decrease from July 2025)
Average Sale Price: $985,000 (a 23.1% decrease from July 2025)
Median Sale Price: $985,000 (a 6.2% decrease from July 2025)
Total Sales Volume: $985,000 (a 91.5% decrease from July 2025)
Median Days on Market: 29 days (an increase of 23 days from July 2025)
Average Price per Square Foot ($/sqft): $696 (a 25.9% decrease from July 2025)
Click on Image to Get Current Copper Mountain Housing Market Report
Percent Over/Under Asking Price: 0.0% (a 2.18% increase in leverage from July 2025)
Active Listings: 19 total properties currently on the market in Copper Mountain
Pending Listings: 6 properties currently under contract
Months of Supply: 19 months (overall market inventory level for Copper Mountain)
New Listings: 6 new properties added to the market in July (no change YoY)
Active Listings with Price Drops: 11 properties (representing 57.9% of the active inventory)
Average Price Drop Amount: 6.9% reduction from the original list price
Average Days Until Price Drop: 83 days on the market before a price reduction occurs
Year-to-Date (YTD) 2026 Copper Mountain Market Data
Number of Sales: 24 transactions (an 11.1% decrease from the previous year)
Total Sales Volume: $23,622,400 (a 37.8% decrease from the previous year)
Median Sale Price: $850,000 (a 26.1% decrease from the previous year)
Average Sale Price: $984,267 (cumulative average for 2026)
Average Price per Square Foot ($/sqft): $951 (cumulative average for 2026)
Median Days on Market: 24 days (an increase of 9 days from the previous year)
Average Percent Over/Under Asking Price: -2.88% (a 0.54% increase in leverage from the previous year)
New Listings: 43 new properties added YTD (a 6.5% decrease from the previous year)
Up-to-Date Market Statistics in Copper Mountain, CO - Updated Daily
Access continually updated Natalia’s real estate market graphs, refreshed daily to ensure you have the latest data in Copper Mountain, CO. To obtain customized charts and graphs for your specific market segments in Copper Mountain—encompassing price range; property type (residential, commercial, parcel, land); area (city, zip code, subdivision); property subtype (single-family home, condo, townhome/duplex); and even detailed criteria like bedrooms, bathrooms, square footage, and year built—please reach out to Natalia at 970-389-8899 or email summitrealty@luckymountainhome.com.
Median Home Price in Copper Mountain, CO
What is the median home price in Copper Mountain CO?
The median home price in Copper Mountain CO is $985,000.
I like to explain the median sales price to my clients as the ultimate "benchmark" for understanding what your money buys in today's market in Copper Mountain, CO. It is the exact halfway point of all recent home sales: 50% of buyers paid more, and 50% paid less. This gives us a crystal-clear snapshot of the "typical" transaction in Copper Mountain CO real estate. For instance, if I tell you the median sales price in your desired Copper Mountain neighborhood is $500,000, you immediately know that half the homes there are selling below that mark, which is great news if you're on a budget, and half are selling above it, which is helpful if you're looking for premium features. It cuts through the noise of unusually high or low sales, allowing us to set realistic expectations and craft a winning strategy for your specific price point.
Average Home Price in Copper Mountain, CO
What is the average home price in Copper Mountain CO?
The average home price in Copper Mountain CO is $985,000.
The average price homes sell for in Copper Mountain is figured out by taking all the money from home sales in a Copper Mountain specific neighborhood(s) and time and then splitting that by the number of homes sold. This single number can quickly show us how well the Copper Mountain housing market is doing and what's happening with home values.
However, it's key to understand that this one number doesn't tell the whole story. Let's say the average selling price in the area is $830,000. This doesn't mean every home is priced the same. You'll likely see a mix: smaller, older homes might go for $550,000, while larger, recently updated ones could sell for over $2,000,000. The average simply brings these different prices together.
New Listings in Copper Mountain, CO
How many new listings came on the market in Copper Mountain CO in July 2026?
6 new listings were added to the market in July in Copper Mountain.
New listings hitting the market in Copper Mountain are often a golden opportunity for buyers, especially in a competitive landscape. These fresh properties haven't been picked over, meaning you could be among the first to discover a hidden gem before others even know it exists. As your Copper Mountain agent, I always advise my clients to act swiftly when a new listing perfectly matches their criteria. For instance, if a ski-in, ski-out residence in desirable Spruce Lodge popped up, we would have to view it right away so we could quickly present our offer and beat out any other interested parties simply by being proactive.
Active Listings in Copper Mountain, CO
What is the current inventory in Copper Mountain CO?
There are currently 19 active listings in Copper Mountain.
An active listing signifies a property that has been officially placed for sale and is being actively marketed to potential buyers. It means the seller is ready to entertain offers and move forward with a transaction. From my perspective as a Copper Mountain real estate professional, monitoring active listings is crucial. Take, for example, the spacious family home in Lewis Ranch at Copper Mountain. It's been an active listing for a few weeks, and while it's received some interest, the sellers are now open to negotiating on certain terms, which wasn't the case when it first hit the market. This flexibility can make an active listing in Copper Mountain even more appealing.
Sold Listings in Copper Mountain, CO
How many homes were sold in Copper Mountain CO in July 2026?
1 home was sold in Copper Mountain in July.
Ever wondered what your Copper Mountain property is actually worth? While list prices give us a starting point, "sold" listings tell the real story. These final sale prices are the gold standard for pricing your home in Copper Mountain effectively. Take, for instance, a beautiful two-bedroom condo in Taylors Crossing near the lake in Copper Mountain. By diving deep into the data of similar condominiums sold in the last few months—comparing everything from views to finishes—Natalia is able to price it perfectly. The result? A quick, successful sale that will leave you, my clients, thrilled with a final price higher than you had imagined.
Pending Sales in Copper Mountain, CO
How many homes went under contract in Copper Mountain in July 2026?
6 homes went under contract in Copper Mountain in July.
In real estate, a 'pending' listing signifies that a seller has accepted a buyer's offer, and the transaction is progressing through its stages. This phase typically encompasses critical steps such as property inspections, appraisals, and securing financing. While a pending status indicates significant progress towards a sale, it is not a finalized agreement. Prudence is advised, as transactions can still encounter unforeseen challenges, potentially leading to the property re-entering the Copper Mountain housing market.
Average Number of Showings to Pending in Copper Mountain, CO
How many showings are needed until a home sells in Copper Mountain CO?
Homes receive 1.5 showings on average before going under contract in Copper Mountain.
Let's tackle the million-dollar question (or the 'how many times do I have to clean my house for strangers?' question): 'How many showings until my home finally sells?' As your Copper Mountain real estate agent, I'm here to tell you there's no magic number. But, if we're talking averages, most real estate agents mention that a typical home needs about 10 to 25 tours before someone says, 'I'll take it!'
However, this number serves more as a suggestion, significantly influenced by whether the market is a buyer's buffet or a seller's sprint, as well as the condition of your Copper Mountain home—whether it resembles a Pinterest dream or a 'fixer-upper' adventure.
In a hot seller’s market, the luxury property by West Tenmile Creek, such as Union Creek Townhomes, can sell even without hitting the market or right after the first showing. Meanwhile, a golf course townhome in Elk Run at Copper Mountain with higher HOA dues, in a more 'chill' market, can clock in around 20 showings before we find the right buyer. So, while those averages are a fun little guide, remember: every home's journey to 'pending' is its own unpredictable way.
Average Days on Market in Copper Mountain, CO
How quickly are properties selling in Copper Mountain CO?
The average days on market (DOM) for a property in Copper Mountain is 50 days.
What does "Average Days on Market" mean for you as a seller in Copper Mountain? As your Copper Mountain agent, I believe in empowering you with knowledge. The "Average Days on Market" (DOM) is a straightforward yet powerful tool that tracks how long it takes for a home in a specific area, for example, the Copper Creek golf course neighborhood, to go under contract. In a seller's market, the DOM is low, as high demand leads to rapid sales. In a buyer's market, the DOM is higher, and homes take longer to sell. This metric is our reality check; if your Copper Mountain property has been listed for twice the average DOM—say, 60 days versus a 30-day average—it’s a signal to collaboratively reassess our pricing and presentation. Understanding the DOM is fundamental to positioning your Copper Mountain home to sell successfully.
Average Price per Square Foot in Copper Mountain, CO
What is the average price per square foot in Copper Mountain CO?
The average price per square foot in Copper Mountain is $696.
For anyone navigating the Copper Mountain home market, the average price per square foot is a critical metric, helping to contextualize a property's value against its physical size. This measurement is straightforward: the total sale price of a home divided by its finished square footage. It provides a uniform benchmark for comparing diverse properties across Copper Mountain, even when their total areas differ significantly. As a real estate professional, I'm showcasing two condominiums in Copper Mountain: one listed at $1,299,000 with 1,541 square feet in the Peregrine condo and another at $1,200,000 with 1,165 square feet in the Mountain Plaza condo. Calculating their price per square foot reveals the first at $843 and the second at $1,030 per square foot. This immediate comparison reveals that, despite a lower sticker price, the smaller home carries a higher per-square-foot cost, prompting us to delve into potential explanations like superior interior appointments, a premium location, exceptional views, year of construction, and recent improvements. It's an indispensable tool for informed decisions, yet it must always be considered alongside other vital aspects such as location, condition, and features.
Average % Over/Under Asking Price in Copper Mountain, CO
Are properties in Copper Mountain CO selling at, below or over the asking price?
On average, properties in Copper Mountain are selling at their asking price.
Understanding market behavior in Copper Mountain is key to successful home sales, and as your real estate agent, I pay close attention to the average percentage of the last list price. This metric quantifies, on average, how close homes in a particular Copper Mountain neighborhood are selling to their final advertised price. An average of 96%, for example, means that Copper Mountain homes are generally selling for 96% of what they were last listed for. If this average reaches 102%, it suggests a seller's market, where properties often sell above their asking price due to intense buyer competition. This is a strong reflection of buyer demand and negotiating dynamics. Imagine selling your stunning new construction home in a community where the average consistently sits at 98%; this indicates that buyers are typically securing about a 2% price reduction. Equipped with this data, we can strategically price your home to attract serious purchasers and anticipate offers slightly below our initial asking, thereby ensuring we are well-prepared to achieve your selling goals.
Dollar Volume of Closed Sales in Copper Mountain, CO
What was the total sales volume for July 2026 in Copper Mountain?
The total sales volume in Copper Mountain is $985,000 in July.
Dollar volume of closed sales in the Copper Mountain, CO, real estate market refers to the cumulative monetary value of all properties whose sales have been successfully concluded within a particular timeframe. This metric is a vital gauge of market activity and robustness, indicating precisely how much capital is actively changing hands. Picture it as the grand total on a massive receipt detailing every property sale. As an example, if a real estate agent closes three properties this month—a $700,000 condo in Copper Mountain, a $3,850,000 family house in Silverthorne, and a $2,800,000 luxury townhome in Keystone—her total dollar volume of closed sales for the month would be $7,350,000. This figure is instrumental in assessing personal achievement and the underlying strength of the market, offering more than just a count of transactions.
Monthly Supply of Homes for Sale in Copper Mountain, CO
What is the monthly supply of homes (overall market inventory level) in Copper Mountain CO?
The Copper Mountain market has 19 months of supply. It is the buyer's market now.
The monthly supply of homes for sale serves as a vital barometer for the activity level within the Copper Mountain housing market. It effectively measures the dynamic interplay between the volume of available homes and the pace of sales. Picture it as an "inventory countdown": this figure specifically indicates the duration, in months, it would take to sell every single property currently listed in Copper Mountain, provided no new listings appear. As a real estate advisor, I regularly employ this statistic to guide my clients on negotiation strategies. When supply is constrained—typically less than five months—it creates a seller's market, fostering buyer competition and often elevating property values. Conversely, a supply extending beyond six months establishes a buyer's market, affording more time and leverage for negotiating optimal terms. For instance, if 300 homes are presently available in our community, and the average monthly sales stand at 100, we are looking at a three-month supply. This signals a brisk market, necessitating prompt decisions and compelling offers from those looking to purchase.
Data Source
All market data is sourced from Altitude MLS, Inc. via InfoSparks (Showing Time Plus, LLC). Data is updated in real-time according to MLS feed updates.